Observing the Observer (Fluent Bit monitoring)

Tags

, , , , , , , ,

In the Fluent Bit book I touch upon the point that we should be observing the observer. After all, if we don’t monitor our observability stack, then we’ll be operating blind and may never know until things go catastrophically wrong, and we’re getting complaints that production business solutions are down. One of the peer review comments was it would be really good to have a visual representation in the book. While I’d love to incorporate such diagrams, for them to be readable, they do use up a lot of space on the printed page, and very long chapters can also put some readers off. So, given the point wasn’t a key theme, we simply couldn’t incorporate the diagram.

But the suggestion is a good one. So we’ve created the visual representation here.
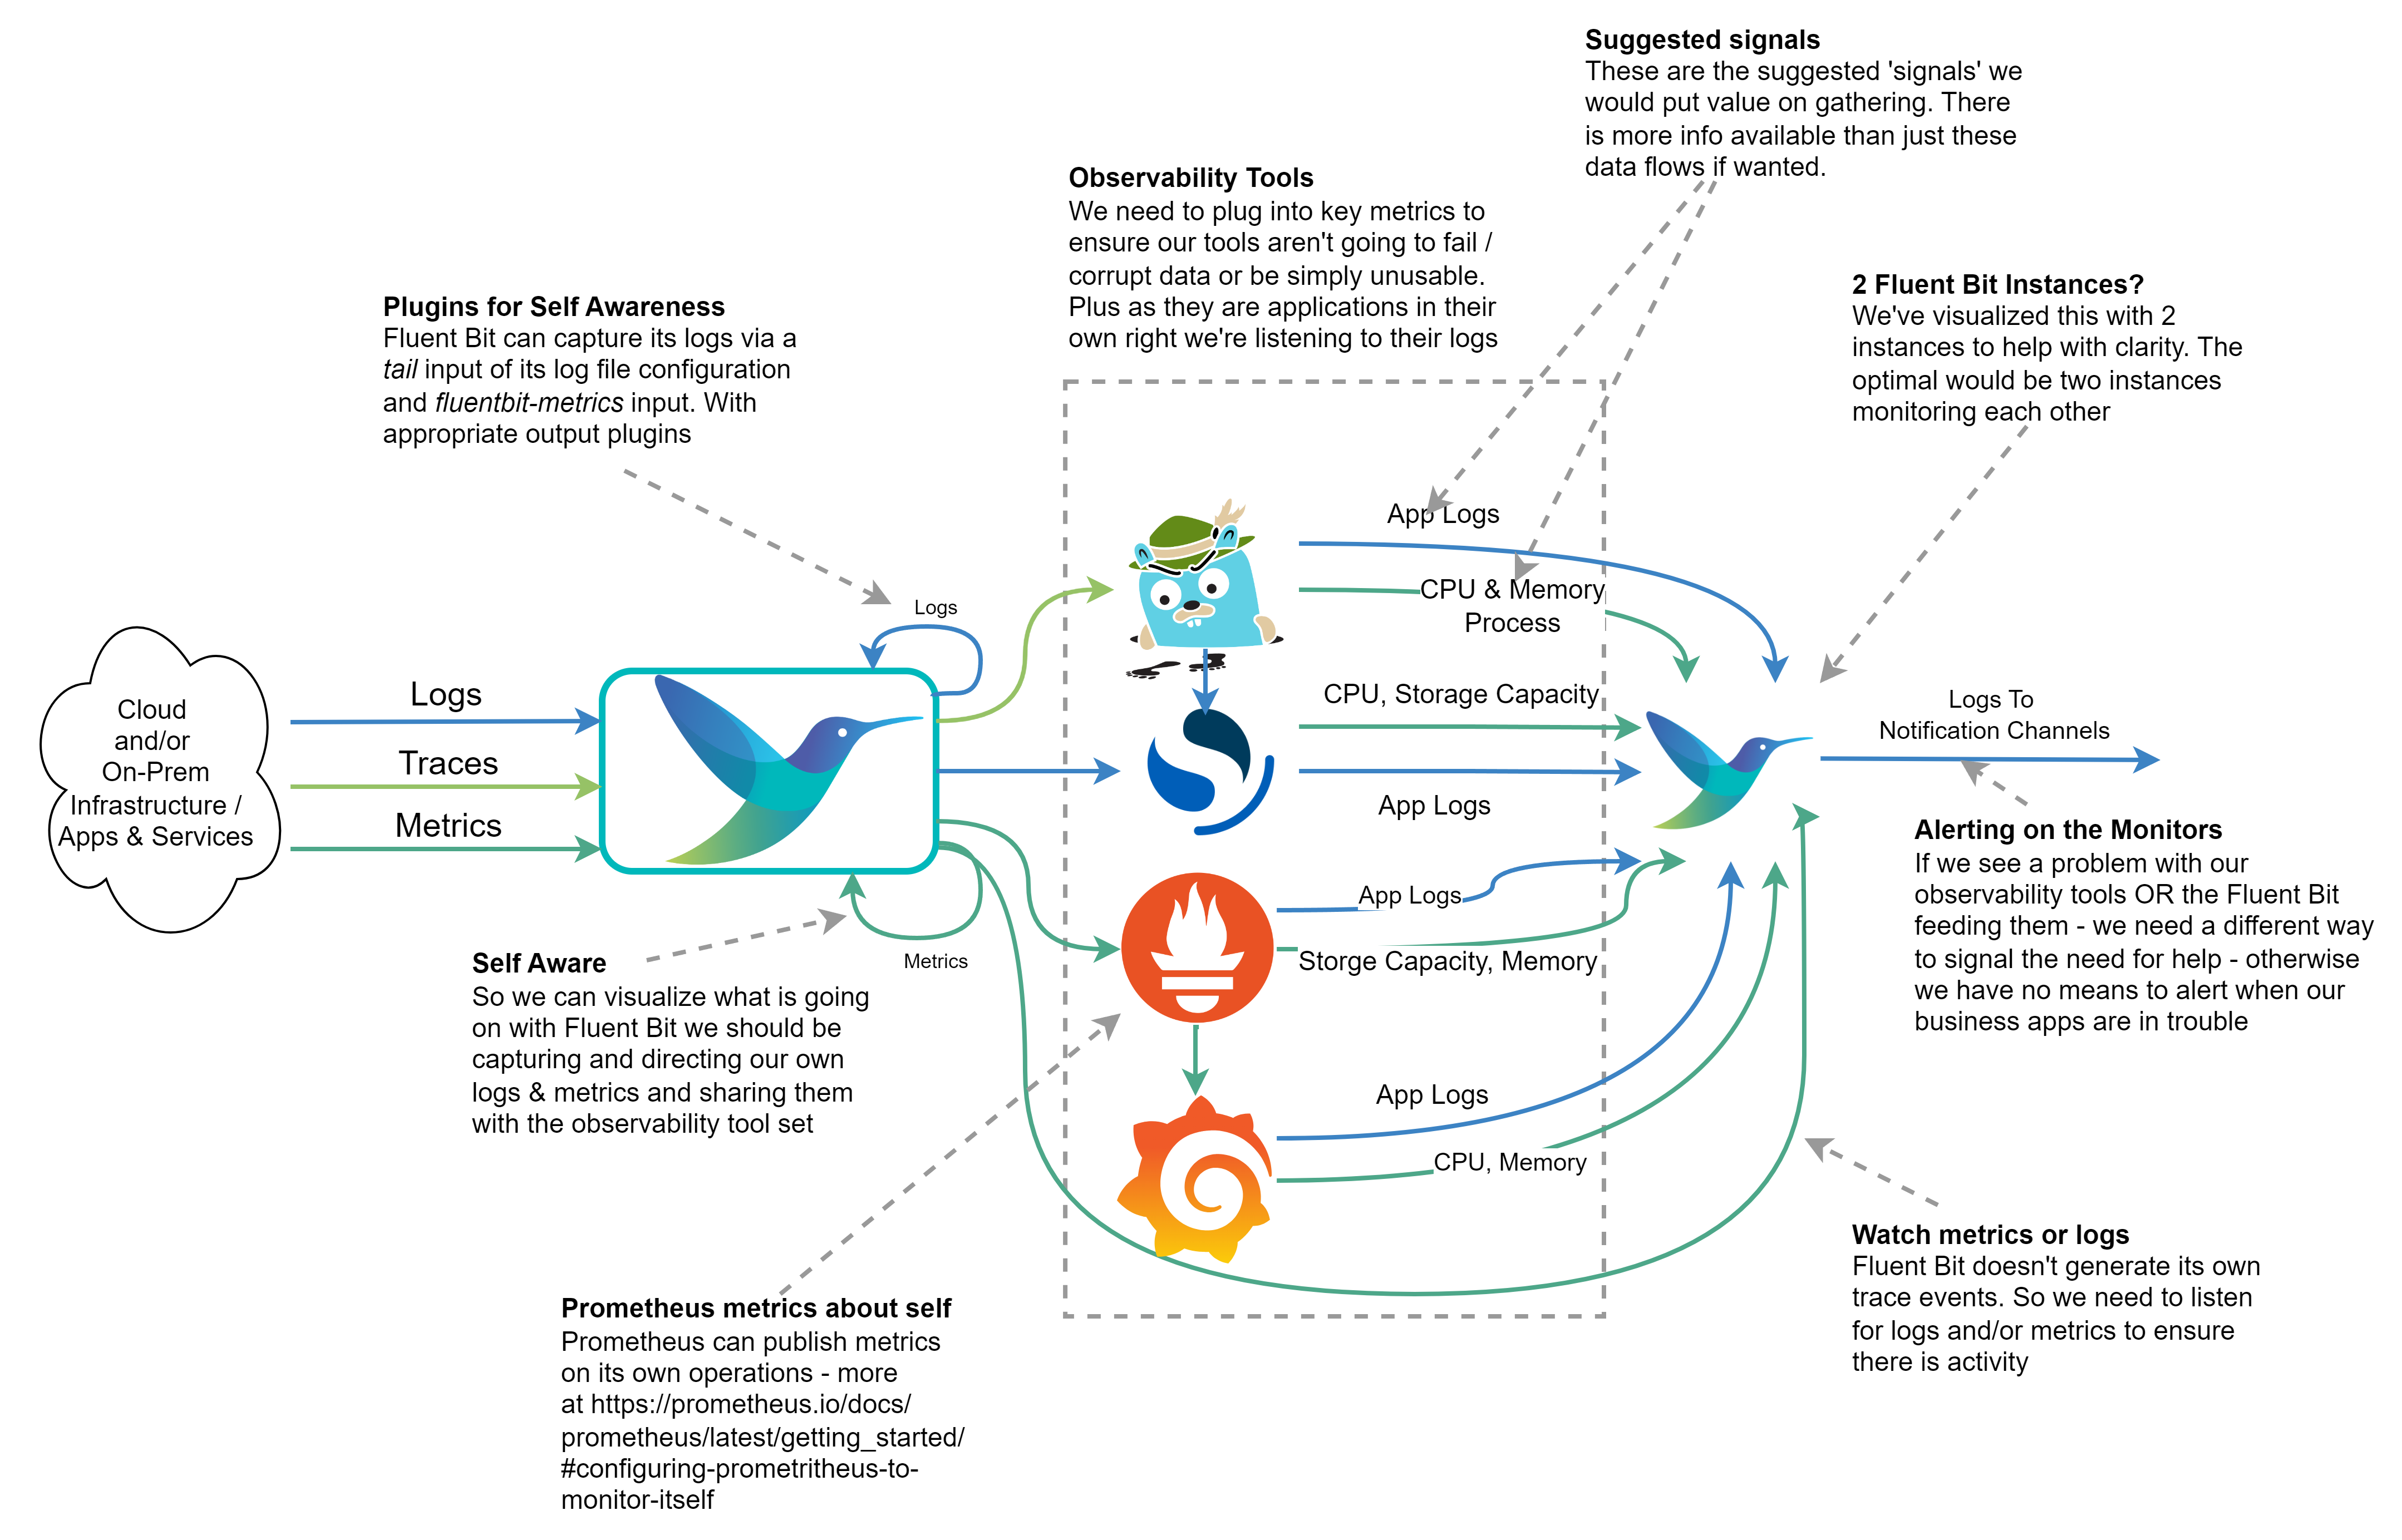
Annotated diagram showing how Fluent Bit could be used to monitor an open-source observation stack.

If we’re running everything within a Kubernetes cluster, it would be easy to say we don’t need such a sophisticated setup as we can use Kubernetes liveness probes if the containers are well configured. While it is true if one of our services starts to fail, a liveness check should pick it up and recycle the container. But such probes only worry about the HTTP response code, not the cause. If we don’t monitor and capture more information we’ll never understand the problem. At worst we could end up seeing Kubernetes starting and then killing our containers in a vicious cycle and struggling to resolve the cause. So collecting the logs and metrics remains just as important.

How to Publish Fluent Bit Metrics and Logs

To publish Fluent Bit’s metrics to Prometheus, we need to configure the fluentbit-metrics input plugin (it does sound odd as an input, but there are reasons that become clearer in the book). We then route the output that supports using Fluent Bit as a Prometheus node exporter or makes use of the remote write API.

The log output for Fluent Bit can be configured via the command line or in the SERVICE blog (using the attributes log_file and log_level in the configuration file. Today this is setting the log threshold and identifying the log file. We can then, of course, configure a tail input plugin against the file if we want to send the logs to OpenSearch. We can also set plugin-specific logging thresholds as overrides to the Fluent Bit wide setting in the SERVICE block of configuration.

Configuring the other monitoring tools

  • Grafana‘s configuration will allow it to publish Prometheus scrapable metrics and Traces that are OTLP compliant can be found documented here.
  • Prometheus provides metrics on itself (details here) and logging controls as part of its command line and generates logfmt or JSON logs, details here.
  • OpenSearch‘s logs can be accessed as documented here. The Logs are created with Log4j2, which means out of the box, it will be easy to parse them. Configuring the output of slow query reports does need to be switched on. OpenSearch also illustrates a pre OpenTelemetry/OpenMetrics approach to sharing internal metrics by writing them as logs. However, there are ways to convert such log events to OTLP Metrics with Fluent Bit.
  • Jaeger provides metrics endpoints that are Prometheus-compatible, along with JSON-based logs, and are documented here. There is some support for tracing.

InfoQ Article on Fluent Bit with MultiCloud

Tags

, , ,

I’m excited to say that we’ve had an article on Fluent Bit and multi-cloud published on InfoQ. Check it out at https://www.infoq.com/articles/multi-cloud-observability-fluent-bit/ . This is another first for me.

As you may have guessed from the title, the article is about how Fluent Bit can support multi-cloud use cases. As part of the introduction, I walked through some of the challenges that aren’t so obvious when operating with a multi-cloud scenario. The following diagram illustrates that.

The book is now in its final peer review process with updates also being sent to the Early Access Program as well (MEAP).

Fluent Bit book cover

Fluent Bit with Kubernetes – more MEAP chapters

Tags

, , , ,

12th April Update – The last chapter, a use case Appendix, and a couple of chapter updates are heading to the MEAP release.

We’ve not been blogging too much as we’ve been very focused on the book. For the keen readers who have signed up for the MEAP (Manning Early Access Programme) of the book, another 2 chapters are in the process of being made available.

The last chapter has been submitted to our editor along with the appendix, which includes an enterprise use case that outlines a business scenario and illustrates how Fluent Bit can be applied.

We’ve received the feedback from the second peer review and have started to address it. I’m sure that every Manning author will testify as to how helpful the process is. While I recommended some of the reviewers to my editor, I didn’t know others. All the feedback comes back anomalously. So publicly, thank you to the reviewers. Constructive feedback is key to how we ensure that we are getting our points across, but also how details we may have overlooked or thought obvious get put right.

Unfortunately, authors can’t always address every comment. Sometimes, that is down to the fact that the layout has to work within the publisher’s guidelines. Sometimes, we simply can’t fit in suggested content, as we’re ultimately working to an agreed timeline, and people can be put off by 800-page books. For me, and I suspect other authors, those extras aren’t ignored; they’re fuel for blog ideas and content.

We’ve one more peer review cycle where the reviewers get pretty much the entire book, and once any edits for that are needed, we move into the copy editing, which is done by Manning, and I just need to confirm edits don’t accidentally change the meaning and emphasis. This will be a time when we can start blogging and sharing more.

Fluent Bit the engine to power ChatOps – update

Tags

, , , , , ,

The other month, I described a presentation and demo (Fluent Bit – Powering Chat Ops) we’ll be doing for the Cloud Native Rejekts conference, which is the precursor event to KubeCon in Paris this week. Since that post, we’re excited to say that, with Patrick Stephens’s contributions from Chronosphere, the demo is now in the Fluent GitHub repo. It has been nicely packaged with a Docker Compose, so everything runs in a couple of containers.

In addition, if you want to see the presentation and hear us discuss the solution and explain how it works, we recorded part of the presentation dry run, which can be heard here (Demo) and here (Code overview).

I couldn’t be in Paris in person, so Patrick took the job of presenting in Paris, we tried to enable my remote participation but had audio issues. Hopefully, you’ll see the recording of Pat’s physical presentation here. But I did manage to collaborate in the demo:

This means that the original repo I mentioned can be viewed as a beta or upstream version (it’s cluttered with some generated code from Helidon, which we will eventually get around to exploiting and making the utility a native binary executable).

Fluent Bit with Kubernetes book update

Tags

, , ,

A quick update on the book – very early this morning or late last night (depending on your perspective), we sent our development editor the final chapter of the Fluent Bit with Kubernetes book. There is still a way to go before we’re completed (with multiple reviews to happen, appropriate edits to be made, copy editing, etc. Still, it is an important milestone from an author’s perspective.

For the keen readers who have signed up for the MEAP (Manning Early Access Programme) of the book, I can confirm that the editorial team (preparation for eBook and website formatting, checking the edits to address the Technical Editor and Development Editor haven’t introduced any obvious issues) are working on the preparation of Chapter 7 – so that should be available soon. When this chapter is available, the content covering all the foundational aspects of Fluent Bit will be available. The remaining chapters reflect the advanced features.

Fluent Bit – Powering Chat Ops

Tags

, , , , ,

When it comes to observability, particularly logs, and traces, there is a historical tendency to process things in a batch manner or even only once the need to determine the root cause of an outage, often only using something in the metrics to indicate something might not be right. This misses a real opportunity given Fluent Bit can capture observability events in near real-time, whether that is a log, metric, or trace indicating something unhealthy; why not present the issue to those performing an ops role as soon as it is recognized by Fluent Bit. Not once the data is processed by a back end?

While we have solutions like PagerDuty, they tend to be integrated with back-end event analytics tools. Fluent Bit can talk to social channels such as Slack – so why not direct critical events to Slack and interact with the Ops team more directly. After all, if we’re told quickly about an imminent issue or as soon after something wrong occurs, the impact and effort involved in remediation and recovery are smaller. This is the basis of a presentation that Patrick Stephens (from Chronosphere and a committer to the Fluent Bit project) and I have put together. Patrick will be leading the session at the Cloud Native Rejekts conference in Paris (the ‘b side’ to Kube Con Europe), which takes place on the two days before Kubecon itself.

The session looks at the idea of what has been called ChatOps, why and how it can bring value, facilitated with a demo of using Fluent Bit to detect and share an event with Fluent Bit and also pick up and handle directions from the Ops team in the Slack channel.

We hope you’ll see from the session why we think the approach is worthy of consideration and how the potential security considerations can be mitigated. The MVP code is currently here but may, in due course, actually be migrated to the Fluent repos here.

We’ve bundled readme content and scripts to build and help test the additional functionality created to facilitate part of the operation.

We don’t want to spoil the presentation, so we won’t share too much. But it’ll also be worth checking with the blog, seeing as we’ll record a video and eventually record a session explaining the MVP’s ins and outs.

Fluent Bit with Kubernetes – quick update

anyone tracking the Fluent Bit with Kubernetes book progress will be pleased to know that several more chapters are being made available via MEAP (Early Access Program). This includes additional appendices.

We’re hoping to have the first draft of the final two chapters completed in the next couple of weeks so they can start the editorial and go into the peer review process. This includes chapters on extending Fluent Bit through WebAssembly and the Go language with an example of a multi-purpose DB input and output capability.

Fluent Bit with Kubernetes – book update

Tags

, , , , , ,

The exciting news is that Manning have released several more chapters of our Fluent Bit with Kubernetes book into the MEAP (Manning Early Access Program) – which means about two-thirds of the book is now available in MEAP form.

We’ve also been beefing up the supporting and related information on this website – as we can’t get everything into the book – for the static pages, the most relevant are here and here, and the blog post content can be seen here.

The sample configurations are in our GitHub repo here, and additional demos can be found here. We’ve got a pretty cool demo being built, which takes Fluent Bit into the world of ChatOps (and it isn’t just sending notifications) – it will eventually become visible in the repo – but to see it sooner, keep an eye out for our conference presentations.

Fluent Bit with Oracle Cloud

Tags

, , , , , , , , ,

The hyper scaler cloud vendors all offer Logging and monitoring capabilities. But they tend to focus on supporting their native services. If you’re aware of Oracle’s Cloud (OCI) messaging, then you’ll know that there is a strong recognition of the importance of multi-cloud. This extends not only to connecting apps across clouds but also to be able to observe and manage cloud-spanning solutions. Ultimately, most organizations want to headline observability-related views of their solutions.

Late last year, I presented these ideas, illustrating the ideas with the use of Fluent Bit and OCI’s Observability and Management products to visualize and analyze what is happening. I finally found the time to write how the very basic demo was built from a clean sheet over on the Oracle Devs blog on Medium.

Useful Resources for Fluent Bit and Observability

This also highlights the fact that the Fluent Bit book, while I believe, once completed, will be through, can’t cover everything – and certainly not build end-to-end use cases like the Oracle Observability & Management example. To help address this, the book includes an appendix of helpful additional information, some of which I have included here, along with other content that we encounter – all of which can be found at Fluentd & Fluent Bit Additional stuff.

Cloud Observability in Action – Book Review

Tags

, , , , , , , , , ,

With the Christmas holidays happening, things slowed down enough to sit and catch up on some reading – which included reading Cloud Observability in Action by Michael Hausenblas from Manning. You could ask – why would I read a book about a domain you’ve written about (Logging In Action with Fluentd) and have an active book in development (Fluent Bit with Kubernetes)? The truth is, it’s good to see what others are saying on the subject, not to mention it is worth confirming I’m not overlapping/duplicating content. So what did I find?

Observability in Action by Michael Hausenblas
Cloud Observability in Action by Michael Hausenblas

Cloud Observability In Action has been an easygoing and enjoyable read. Tech books can sometimes get a bit heavy going or dry, not the case here. Firstly, Michael went back to first principles, making the difference between Observability and monitoring – something that often gets muddied (and I’ve been guilty of this, as the latter is a subset of the former). Observability doesn’t roll off the tongue as smoothly as monitoring (although I rather like the trend of using O11y). This distinction, while helpful, particularly if you’re still finding your feet in this space, is good. What is more important is stepping back and asking what should we be observing and why we need to observe it. Plus, one of my pet points when presenting on the subject – we all have different observability needs – as a developer, an ops person, security, or auditors.

Next is Michael’s interesting take on how much O11y code is enough. Historically, I’ve taken the perspective – that enough is a factor of code complexity. More complex code – warrants more O11y or logging as this is where bugs are most likely to manifest themselves; secondly, I’ve looked at transaction and service boundaries. The problem is this approach can sometimes generate chatty code. I’ve certainly had to deal with chatty apps, and had to filter out the wheat from the chaff. So Michael’s approach of cost/benefit and measuring this using his B2I ratio (how much code is addressing the business problems over how much is instrumentation) was a really fresh perspective and presented in a very practical manner, with warnings about using such a measure too rigidly. It’s a really good perspective as well if you’re working on hyperscaling solutions where a couple of percentage point improvements can save tens of thousands of dollars. Pretty good going, and we’re only a couple of chapters into the book.

The book gets into the underlying ideas and concepts that inform OpenTelemetry, such as traces and spans, metrics, and how these relate to Observability. Some of the classic mistakes are called out, such as dimensioning metrics with high cardinality and why this will present real headaches for you.

As the data is understood, particularly metrics you can start to think about how to identify what normal is, what is abnormal, or an outlier. That then leads to developing Service Level Objectives (SLOs), such as an acceptable level of latency in the solution or how many errors can be tolerated.

The book isn’t all theory. The ideas are illustrated with small Go applications, which are instrumented, and the generated metrics, traces, and logs. Rather than using a technology such as Fluentd or Fluent Bit, Michael starts by keeping things simple and directly connecting the gathering of the metrics into tools such as Prometheus, Zipkin, Jaeger, and so on. In later chapters, the complexity of agents, aggregators, and collectors is addressed. Then, the choices and considerations for different backend solutions from cloud vendor-provided services such as OpenSearch, ElasticSearch, Splunk, Instana and so on. Then, the front-end visualization of the data is explored with tools such as Grafana, Kibana, cloud-provided tools, and so on.

As the book progresses, the chapters drill down into more detail, such as the differences and approaches for measuring containerized solutions vs. serverless implementations such as Lambda and the kinds of measures you may want. The book isn’t tied to technologies typically associated with modern Cloud Native solutions, but more traditional things like relational databases are taken into account.

The closing chapters address questions such as how to address alerting, incident management, and implementing SLOs. How to use these techniques and tools can help inform the development processes, not just production.

So I would recommend the book, if you’re trying to understand Observability (regardless of a cloud solution or not). If you’re trying to advance from the more traditional logging to a fuller capability, then this book is a great guide, showing what, why, and how to evaluate the value of doing so.

To come back to my opening question. The books have small points of overlap, but this is no bad thing, as it helps show how the different viewpoints intersect. I would actually say that the Observability in Action shows how the wider landscape fits together, the underlying value propositions that can help make the case for implementing a full observability solution. Then, Logging in Action and the new book, Fluent Bit with Kubernetes, give you some of the common context, and we drill into the details of how and what can be done with Fluent Bit and Fluentd. All Manning needs now is content to deep dive into Prometheus, Grafana, Jaeger, and OpenSearch to provide an end-to-end coverage of first principles to the art of the possible in Observability.

I also have to thank Michael for pointing his readers and sections of Logging in Action that directly relate and provide further depth into an area.

Further reading